
Lealman Crime, By the Numbers: Part 7
Criminal-mischief charges fell in two of the sheriff's Lealman categories after 2021, adding a property-damage finding to the declines in burglary and auto theft. Whether that improvement outpaced the rest of Pinellas County remains unverified.
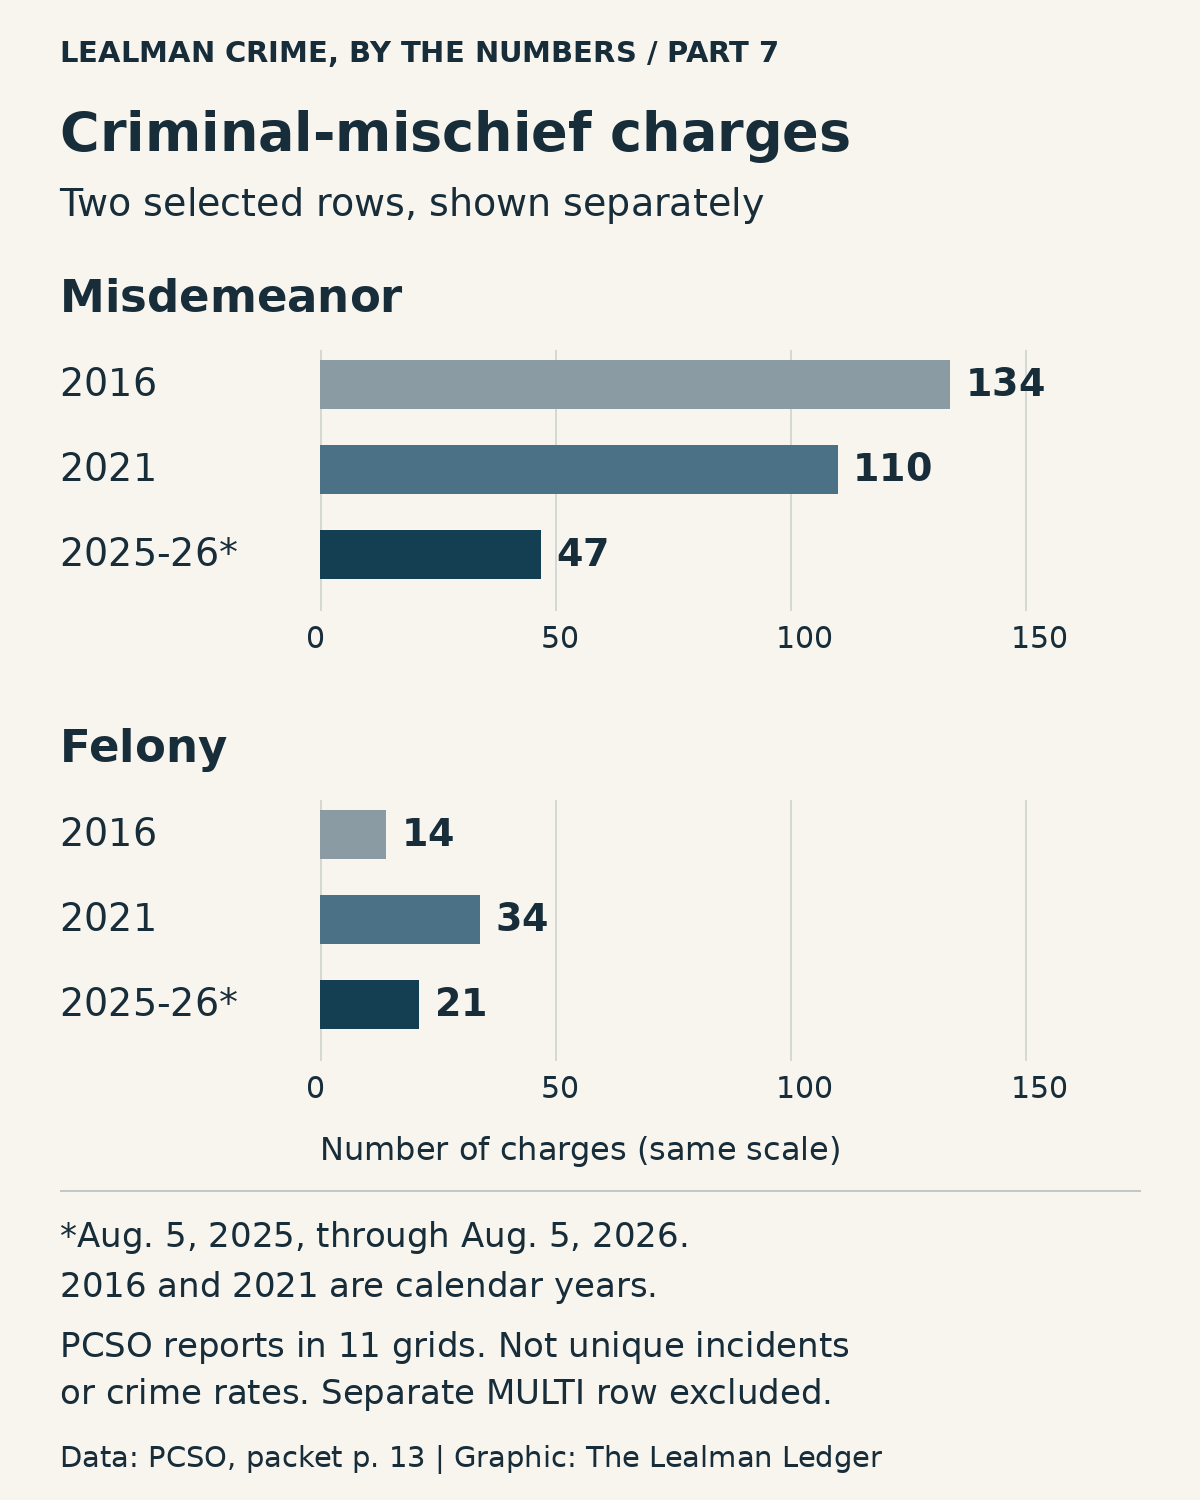
The misdemeanor criminal-mischief row in documents provided by the Pinellas County Sheriff drops from 134 charges in calendar 2016 to 110 in calendar 2021 and 47 during Aug. 5, 2025, through Aug. 5, 2026. The latest count is 63 lower than in 2021, about 57%, and 87 lower than in 2016, about 65%.
The felony criminal-mischief row follows a different path: 14, then 34, then 21. Its latest count is down 13 charges from 2021, about 38%, but remains seven above 2016, an increase of 50%. A decline from the middle snapshot does not mean every category returned below its earlier level.
The graphic keeps those two rows separate. A third row, labeled “CRIM MISCHIEF-MISD *MULTI,” records one, one and zero and is not included in the chart. The packet does not explain that label. None of these figures measures repair bills, the number of damaged properties or the number of people affected.
The planned comparison for this installment was Lealman against the rest of Pinellas. A review of public state, county and city resources did not establish a compatible series for the packet's selected charges, study grids and reporting windows. The criminal-mischief rows provide a supportable local finding without turning mismatched statistics into a ranking.
One problem is the measure itself. The Florida Department of Law Enforcement's Florida Incident-Based Reporting System describes its public figures as Group A offense totals submitted and verified by agencies, organized by incident date. The Lealman packet instead counts selected charges attached to PCSO-generated offense reports. Similar category names do not establish that the two systems count the same things.
Historical coverage also needs attention. FDLE's 2021 county and municipal offense report labels its Pinellas County estimate as based on data representing 53.5% of the population. Its crime-index columns cover murder, rape, robbery, aggravated assault, burglary, larceny and motor vehicle theft. That is a different selection from the Lealman table, which includes drug charges and criminal mischief. The coverage note concerns that historical state estimate; it does not show that the sheriff's Lealman extraction is missing the same share of records.
Nearby city announcements are not a substitute for the rest of the county. In a Jan. 22, 2026 release, St. Petersburg police reported that total crime fell 16% in 2025. That announcement covers a city and a calendar-year change. It cannot be placed beside Lealman's roughly 41% decline in selected charges from 2016 to the latest window to determine which area improved more.
Nor can the rest of Pinellas be calculated by simply subtracting Lealman's 1,523 charges from a county offense total. Subtraction would require the same counting rules, dates and categories, with the Lealman records confirmed as a subset of the county records. Those conditions have not been established.
The county's Crime Viewer offers agency, category and date filters, but warns that classifications can change, agency feeds may be missing and map positions are approximate. It can help residents explore reported activity. Its public description does not establish a match to the packet's extraction of charges in 11 grids.
For the criminal-mischief finding, the limits are specific. Reports from agencies other than PCSO are excluded, and one offense report can supply multiple applicable charges. These are not unique crimes, victims, convictions or population-adjusted rates. The packet does not separate changes in underlying activity from reporting, enforcement or classification changes.
Sheriff Bob Gualtieri's office could make a comparison possible by producing the same charge extract for the same periods outside the 11 study grids, with agency coverage and category definitions stated. A broader comparison of residents' risk would also need matching population boundaries and consistent incident measures. Until then, the local decline can be reported accurately without claiming that Lealman beat the county trend or that Flock cameras caused it.
Previously: Part 6 explained the table's asterisks and missing context. Read the opening installment.